
The tumultuous year of 2020 highlighted the impact of volatility on making data-driven decisions: “decision making with data” ceases to work when your data and methods of analysis become unrecognizable. External disruptors of unprecedented scale have the potential to nullify traditional sources of analysis and traditional technology approaches. What do you do when you are unable to rely on historical information to understand where you need to go? How do you continue to guide your business with data that cannot explain what is happening nor what might likely happen? How do you use data innovatively and adapt to the ‘new normal’?
Volatility Outpacing Traditional Analytics
Traditional forecasting models rely on a baseline of historical transaction data. If you want to predict what is going to happen, you generally look at what has happened. From that historic data, analysts will layer on causal data such as promotions, seasonality, and weather (to name a few) which impact buying patterns, and thus change forecasting models. The combination of this data – historical and causal – provides a robust model for forecasting and identifying market trends. Robust, except in the face of a global pandemic and economic uncertainty of unprecedented scale. Forecast models are an excellent example of common analytic tools which have been majorly disrupted by the COVID-19 pandemic and demonstrate a need to adjust our approaches.
Whether a natural disaster, pandemic, or disruptive innovator, unforeseen events immediately and progressively impact traditional analytical processes, and the uncertainty following the events will continue to challenge these same analytical processes. Handling disruption using innovative approaches must become the norm to stay competitive and responsive. With the pandemic we witnessed that warm weather suddenly did not mean an increase in restaurant dining. Annual promotions did not result in more foot traffic at retailers. Cities and regions went in and out of lockdowns, companies considered (and enacted) furloughs, supply chains have been interrupted as transporters are being drafted to support vaccine distribution, e-commerce channels grew rapidly and are holding demand levels – all this happening quickly and unpredictably.

Figure 1: COVID-19’s impact on demand and costs in the CPG industry (2021 – McKinsey & Company https://www.mckinsey.com/industries/consumer-packaged-goods/our-insights/covid-19s-impact-on-demand-and-costs-in-the-cpg-industry)
This volatility presents a challenge for analysts and, more broadly, the general notion of data-driven decision-making. It necessitates a different approach to data, analytics, and deriving insights. The current pandemic has highlighted our globalized world’s vulnerability to exogenous shocks, and with disruptions occurring more frequently than people estimate, it is likely that we will continue to face situations that cause us to be more resilient and flexible. In the face of volatility, companies need to rethink how they monitor, measure, and manage their businesses. Modern data engineering, data science, and visualization tools are designed to address the need for responsiveness and resiliency in data analytics with numerous tools allowing for availability and accessibility of options. We are seeing significant investments in populating data lake repositories, now looking at more unstructured data, and use of interoperable, flexible tools to process, model, visualize, and draw conclusions from data with agility. There is massive opportunity to democratize data and gain a competitive advantage in leveraging that data to extract value.
Data Analytics: A Prescription for Resiliency
Navigating analytics in a volatile market requires a high level of resiliency; most companies fall notably short of this level. Traditional analyses and approaches must be enhanced to ensure they are responsive and creative to produce insights with agility. The prescription for this resiliency, grounded in data and AI, builds upon four fundamental pillars:
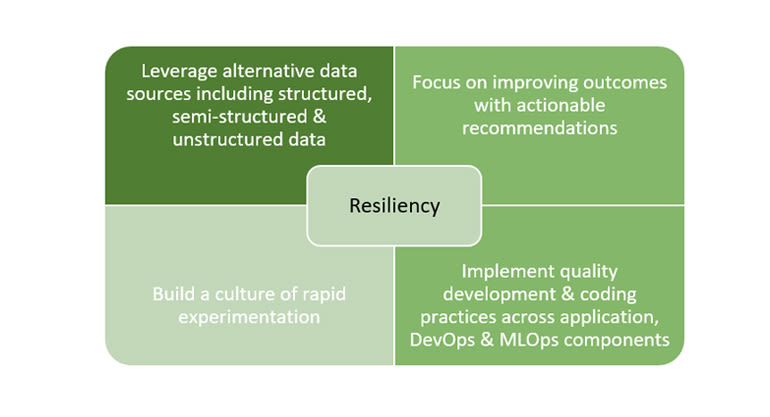
Leverage alternative data sources including structured, semi-structured & unstructured data
Tap into batch, real-time, internal, and external data to expand the breadth of data being used to make decisions. Gain a competitive advantage by cracking the code on how to extract insights from videos, images, PDFs, floor plans, planograms, etc.
Focus on improving outcomes with actionable recommendations
Design an ecosystem that enables data scientists to deliver new insights directly to decision makers on the front-line. Focus on reaching brand leaders, sales managers, and customer experience teams to get information to decision-makers in the field.
Build a culture of rapid experimentation
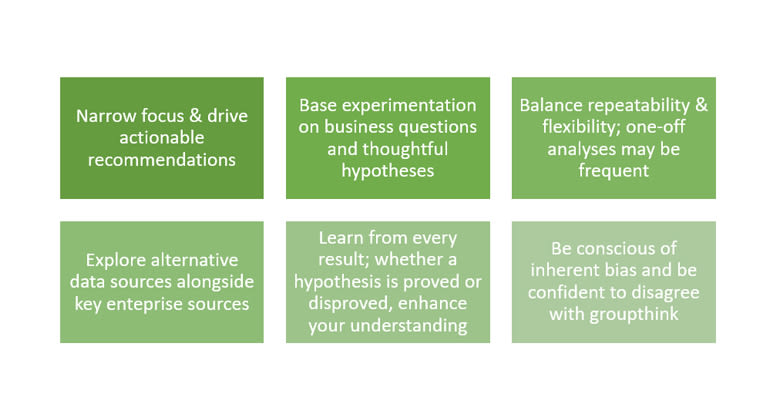
Embrace data exploration and experimentation to explore new datasets, re-imagine traditional analyses, and be responsive in answering business questions. Be confident in trying something new and thinking outside the box and be empowered to do it quickly.
Implement quality development & coding practices across application, DevOps & MLOPs components
Achieve resiliency and achieve high velocity of technical implementation and quick adaptation to new business objectives. Implement quality solutions following highest standards to elicit performance, ease of scale up, and the ability to productionize rapidly into DevOps and MLOps frameworks.
“What most companies need is a quick way to take these different data sets, convert them into useful information, and test that information to see if it contributes to the understanding of their business.”
In cultivating resiliency with data and analytics, there are key principles and capabilities of technology to help accelerate speed to outcomes following practiced solution patterns to generate market and consumer insights.
- Integrated data science and data engineering platform offer collaboration, flexibility in languages, and performance to cultivate a dynamic ecosystem.
- Massive flexibility in scaling allows for responsible cloud consumption, when done appropriately, while achieving high performance of workloads.
- Rapid analysis brings the latest view of data directly to you, either for one-off scenarios or repeatable analyses, with the ability to test new hypotheses.
- Interoperability of tools and languages offers flexibility to use best of breed tools, port solutions, and enable users with different skillsets.
- Thoughtful data lake architecture to host a full complement of internal and external data with supporting tools for orchestration, storage, data movement, data enrichment, and analysis.
- Utilizing enterprise data sources, API’s, and other data connections help paint a bigger, bolder picture to experiment with alternative data sources.
- Machine Learning and AI capabilities offer opportunities to explore the impact of market volatility on existing models, tune them, and create new models using statistical approaches and algorithms to influence decision making.
- Integration with MLOps to manage model lifecycle and track experiments, particularly to support introducing new features, new datasets, and new business scenarios which can arise in an instant.
- Data visualization tools paint a more complete picture of trends and insights and are continually adding advanced analytics capabilities putting the user first.
- Orchestration and business workflow tools take your experiments to production as needed and push solutions into the hands of field users.
The time since the COVID-19 lockdown has seen a fundamental shift in the consumer goods and retail markets, in how buyers behave, and in predictability of the future. Navigating the ‘new normal’, adapting historical processes, and identifying competitive opportunities by influencing decisions from data in a volatile market has been a difference maker for organizations and threat to keep pace with innovation in the industry.
Rapid Analytics in Action: A Case Study
How do we action these ‘pillars of resiliency’ within our analytics teams to respond to market shifts, changing consumer dynamics, and whitespace opportunities for implementing data solutions? Let’s look at a case study featuring a top tier consumer goods company’s approach to promoting analytical experimentation and delivering fast insights to its executives.
Thorogood, a professional services firm specializing in data engineering, data science and data visualization, helped a long-standing blue chip consumer goods client navigate the volatility brought on by disruption by delivering rapid market analytics using the Azure ecosystem.
Key Principles of the Initiative Leading to Success:
The foundation of analysis was built from integrating various datasets (internal sell-in, national economic results and projections, daily COVID trends and forecasts, external POS sell-out, etc.) with accuracy and speed into a well-curated data lake repository. Azure Databricks offered the use of Spark for data engineering and data science functionality for data preparation and model training and validation at-scale across large datasets in parallel, allowing more time to focus on experimentation, iteration with the business, and market analysis. Using the tool with greater parallelization and parameterization functionalities enables scalability and applying statistical techniques through a huge number of combinations for experiments that are valuable to re-run. Power BI provided a sleek and user-friendly tool to analyze massive amounts of data and create content for executive presentations. As value was derived in experiments, the analyses were scaled by introducing parameterization and automation to iterate through all brands or categories or retailers in short order.
“We use Azure Databricks, Azure data lake tools [ADLS, Data Factory] and Power BI to answer questions, surface undiscovered insights, and test hypotheses using rapid analytical experimentation. We combine external and internal datasets (including ingestion of new, experimental datasets) and combine sophisticated data science techniques with market intelligence and business understanding to provide an external, unique, and unbiased analysis.”
The below analyses highlight a handful of the exploratory experiments used to formulate recommendations for business executives in helping them respond to COVID-19 impacts and stay competitive in the market:
Market stealers to identify, within a particular channel or segment, who is stealing share by using weighted correlation algorithms on point-of-sale sell-out metrics. Results helped to explain what happened in 2020 and what plans to lay and execute in 2021 such as changes to product mix or promotional strategy.
Product splits to understand how sales of product variants (such as pack size) shifted over given time frames (pre-panic buy, panic buy, post-panic buy, vaccination rollout) using de-seasonalization algorithms coupled with outlier detection methodologies.
Elasticity derivations to understand how sales have been impacted by distribution, pricing, promotion, and the economy using regression models. The results helped fuel recommendations on which brands are likeliest to bounce back in 2021 and how distribution changes will fare impact share and growth.
Economic impact studies to illuminate segments of the market more sensitive to movement in the economy, as a result of consumer behavior, using a combination of product clustering and correlation algorithms on alternative economic data sources from various government agencies.
Consumer preferences using outlier detection on sales trends to identify patterns and probability modelling on panel data to understand how consumer propensity to buy certain brands and products has shifted, and to which brands the shift has been made to.
Check out the below recording which showcases this case study along with additional perspectives on how consumer goods manufacturers and retailers have responded to the impact of economic and social disruption on market volatility.
Databricks & Thorogood: Rapid Market Data Analytics in a COVID-19 World (54 mins)
The Takeaway: A New Approach to Analytics
Identifying real-time trends and insights rapidly and proactively is now a defining feature of robust analytics-driven organizations, and it will continue to be. Businesses that fail to adopt such techniques and approaches will quickly fall behind, identifying forecasts and trends only after their competition has implemented actionable plans. The analytics game is one of timeliness, creativity, and accuracy. Building a culture and ecosystem that is resilient to disruptors is critical to a winning strategy.